QPR ProcessAnalyzer Use Cases: Difference between revisions
| Line 97: | Line 97: | ||
[[File:PathAnalysisParallelismPredecessors.png|800px]] | [[File:PathAnalysisParallelismPredecessors.png|800px]] | ||
=== Flows Analysis in Parallelism Analysis === | === Flows Analysis in Parallelism Analysis === | ||
Revision as of 10:00, 2 December 2018
Here are some important use cases for QPR ProcessAnalyzer functionalities.
Benchmarking
In the following process analysis view, I want to compare the process flows that go through the "Sales Order Changed" and the "Purchase Order to Supplier" activities:
- First, I select the "Sales Order Changed" activity and click the Include Only button to get a filter that shows only the cases that go through the "Sales Order Changed" activity.
- I'll name the filter, so it will be easier to select it later. I click the Manage Filters button in the Filter group on the ribbon to open the Manage Filters dialog.
- The filter is selected on the list, so I click Properties, and give the filter the name "BenchExample1". Then, I click OK to close the Filter Properties dialog, and then Cancel to close the Manage Filters dialog.
- Then, I'll want to do the same to the "Purchase Order to Supplier" activity, so I'll click Change > Restore Default to get the initial unfiltered view visible again.
- I select the "Purchase Order to Supplier" activity, and select Include Only.
- Next, I'll benchmark the current filtered view with the "BenchExample1" I named earlier. From the Flowchart Analysis Settings Benchmarking section, I'll select the "BenchExample1" filter. Now I have the two filtered views visible:
- From the Flowchart Analysis Settings Benchmarking section, I select the "Account Manager" to see the Account Managers who are responsible for the orders:
Filtering
From the process analysis shown below, I want to see activities in only the cases in which the process flow goes from the "Additional Visit" activity to the "First Aid" activity.
- I press down the Ctrl key and click on the "First Aid" and "Additional Visit" activities, so that they are selected.
- Then, by clicking Include Only > Event Types, I get a process analysis with only the two selected activities:
- Now, I select the flow going from "Additional Visit" to "First Aid" and click Include Only > Cases. The result is as follows:
- As the Event Type filter I created before is still active, I select Change > Clear Event Type Filters. Now I have all the activities visible in cases where the process goes from "Additional Visit" to "First Aid":
Working with Large Datasets
When you have a model with a large set of data in QPR ProcessAnalyzer, you can use it for doing comprehensive process analysis by drilling down to a relevant set of data. For example, you can find out root causes for deviations in your process by running Influence Analysis using filters. This will help you smooth out and reduce those deviations and thus improve your process.
To enable running analyses for large data sets in an optimized way, the default sample size for all models has been set to 10,000 cases. This means that all further analyses and filtering will be done using the value of 10,000 cases. For every calculation, cases will be selected randomly to make it a representative sample.
Below are some methods for dealing with a large data set when analyzing a process.
Method 1: Create Base Model with Filtering
When dealing with a large amount of data, it is important to find the relevant set of data for your analysis needs and focus the attention to that part of the process. For example, you can take a baseline process and create a sub-model from it by using e.g. a specific region as the selected attribute to filter the data.
To achieve this, do as follows:
- Open your model in Project Workspace. Flowchart Analysis will open.
- Select Profiling Analysis from the ribbon.
- From the Profiled Attribute in Settings, select the attribute you want to base your analysis. In our example this attribute is region.
- Select the attribute you are interested in from the list and then Include Only (Cases) from the ribbon.
- Now the Flowchart Analysis shows you the sub-model with focus on the particular region you selected. You can also repeat the steps 2-5 using a different attribute to get information related to other attributes than region.
- You can then rename the filter you created (in Manage Filters) so it is easier to find and also make it the Model Default filter.
Method 2: Drill-down from One Analysis to Another
Another way to limit the analysis results is to use the drill-down functionality. First you need to look at the model you have as a basis for further analysis. Then you can limit the data set for analysis by drilling down to a meaningful set of cases. For example, we want to examine the cases of the region we selected earlier.
To achieve this, do as follows:
- Open the model that has the Model Default filter we defined in Method 1.
- In our example, we want to see how many days it takes for cases to be completed in this particular region. To do this, select Duration Analysis from the ribbon.
- Now we want to find out what contributes most to the long duration for this particular set of cases. Select the long-lasting cases from the list and run Influence Analysis from the ribbon. The most contributing factors are at the top of the list.
Next Step: Adjusting the Sample Size
After you have found the focus of your analysis by limiting it to relevant data using the methods described above, you can increase the sample size from the default value of 10,000 cases to include more cases which match your chosen data focus.
To adjust the sample size, do as follows:
- Open the Manage Filters dialog from the ribbon.
- Select the filter you have created and open Properties.
- In the Sample Size group box, select the All: radio button to include all cases (or enter an integer to the Limit To: field if you want to define the limit yourself).
Summary
To summarize, the idea behind managing a large data set is that you first have the preliminary data in your model that will serve as the basis for further analysis. You can then limit that set of data by means of filtering. After detecting a problematic area in your process, you can drill down using one or several appropriate analyses to find reasons for bottlenecks, among other things. It is recommended to keep the data sample (that is, number of cases) limited to the default of 10,000 cases at first so running analyses is fast but when you have found the focus for your analysis by narrowing the scope, you can increase the sample size to include more cases.
How to Publish Analysis Results to Others
A pre-requisite for publishing results to others is a suitably small analysis, as a complex analysis result is harder to understand. So first use filters to make the analysis more clear.
There are two ways to publish the analysis:
1. Static sharing
- Use QPR ProcessAnalyzer to create analyses and rename the created Excel worksheet(s) between different analyses you want to share.
- Save the Excel workbook.
- Send the workbook to the recipients or copy paste the workbook into PowerPoint.
2. Dynamic sharing
Dynamic sharing requires that the recipients either already have a user account for the QPR ProcessAnalyzer web service you are using, or that you have sufficient user rights to create a user account for them.
- In the Manage Users dialog, create a group to which you want to share the results. File:User Manager Create Group.png File:Create User Group.png
- Create a Join-in Token, copy it to the clipboard and send it to the recipients for example via E-mail. Note that when using the Join-In Token, the recipient users must already have their own user ID and password for the QPR ProcessAnalyzer web service connection you are using.
- Alternatively, assign or create the recipient users to the group.
- Give the group access rights to the project you want to share.
- Additionally, create Bookmarks of the analyses you want to share.
Detecting Parallelism in Business Processes
QPR ProcessAnalyzer can be used for discovering and analyzing parallelism in business processes. The Event Type, Path, and Flows analyses are used as the starting points for parallelism analyses. After discovering the parallel branch, it can then be further analyzed with, for example, Flowchart Analysis by excluding other Event Types.
Event Type Analysis in Parallelism Analysis
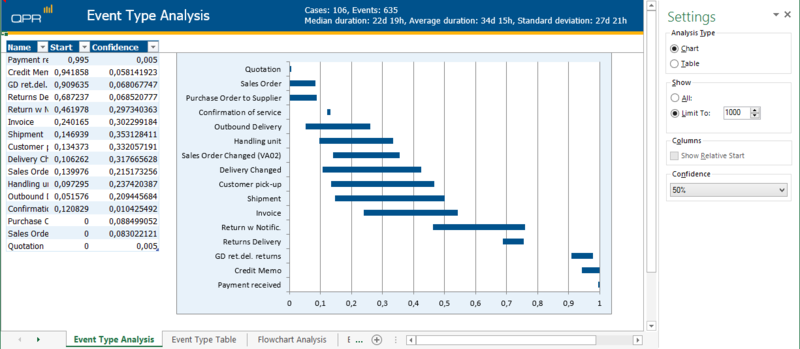
The Event Type Analysis in the Chart mode shows the relative time period for the occurrences of each Event Type. Then it's just a matter of checking which Event Types appear on the same time period, and you see the parallelism:
Path Analysis in Parallelism Analysis
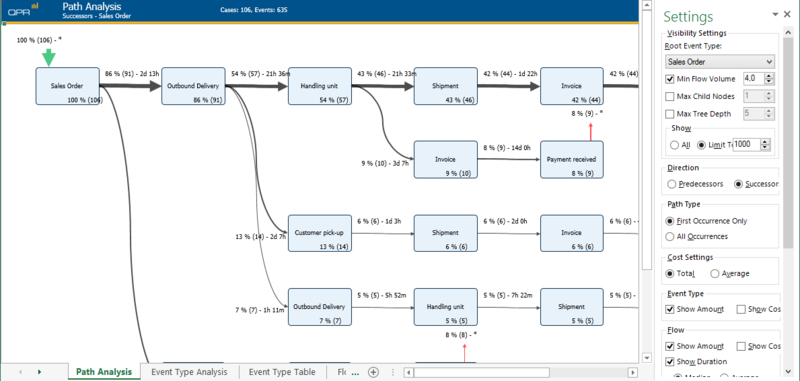
Path analysis graphically shows the Successors for each Event Type. This is a graphical way to discover the Event Types that act as starting points for parallel branches:

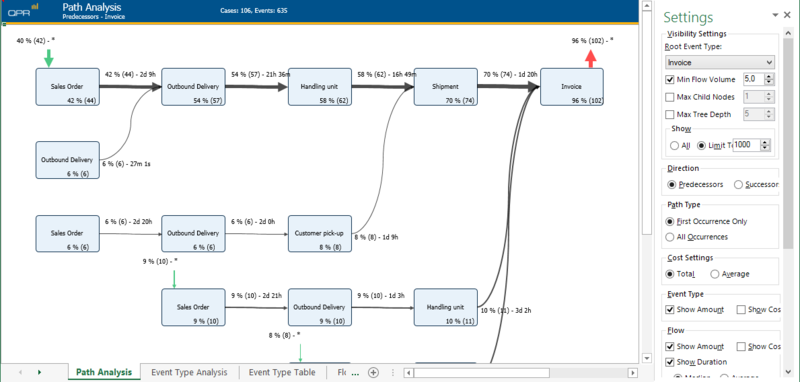
You can also have the Path Analysis show the ending points of the parallel branches by selecting the Predecessors direction:
Flows Analysis in Parallelism Analysis
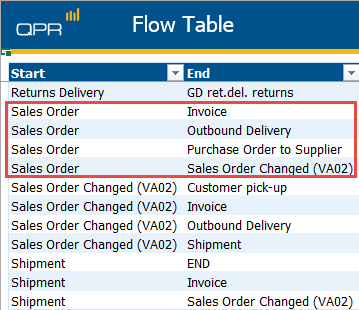
The Flows Analysis makes it possible to discover starting and ending Event Types for parallel branches for the whole model. In the example below, one of branching Event Types is the Sales Order Event Type:
Conformance Checking Using QPR ProcessAnalyzer
QPR ProcessAnalyzer can be used for conformance checking. The guidelines for conformace checking using QPR ProcessAnalyzer are as follows.
Variation Analysis in Conformance Checking
Variation Analysis shows the most frequently followed paths, as well as the paths that are not followed so often. Variation Analysis is specifically useful for discovering conformances that happen quite often, i.e. they have a real meaning for the process.
Flowchart Analysis in Conformance Checking
The Flowchart Analysis can be used to identify exceptions in the process. The Event Types and Flows with low case counts can be regarded as exceptions.
Flow Analysis in Conformance Checking
Flow Analysis gives the information about case counts in tabular format allowing easy statistical analysis. Flow analysis also supports benchmarking by Case and Event Attributes. In addition, Flow Analysis contains the standard deviations for analyzing exceptional durations.
Event Type Analysis in Conformance Checking
The Event Type Analysis lists all events and frequencies allowing an easy, summary-level analysis.
Include Only and Exclude Filtering in Conformance Checking
The Include Only and Exclude mechanism speeds up the filtering of the whole dataset to relevant subsets for conformance checking purposes. For example, the Event Types or cases that can be regarded as valid or conforming can be removed from the analysis.


